2101 Trinity Road
Duluth, MN 55811-3399
United States
Certificates / Diplomas
Associate Degree
About
Lake Superior College offers 90+ certificate, diploma and associate degree programs in career/technical fields and pre-baccalaureate majors for students interested in transferring to a 4-year college or university. LSC provides affordable, quality, hands-on training for a wide range of in-demand careers. You can also start here and save thousands, then seamlessly transfer to earn a four-year degree.
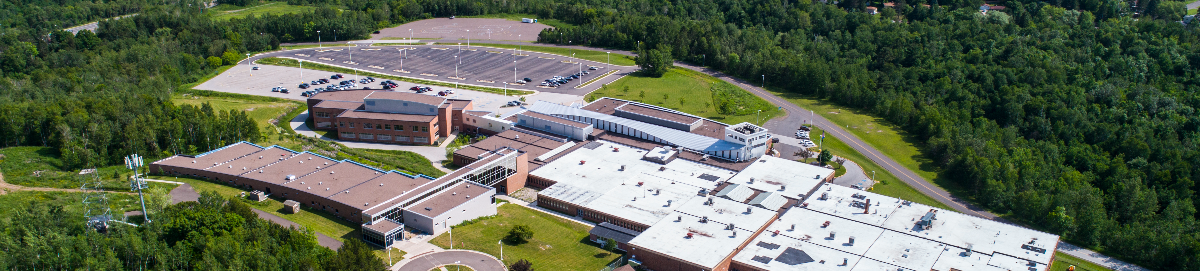
LSC’s main campus is set back on a majestic 97-acre wooded lot overlooking Lake Superior and St. Louis River bay. The campus features an award-winning hiking trail, a designated trout stream (Miller Creek) and access to a city-run disc golf course. Duluth, Minnesota has earned the honor of being named the best 2014 outdoors town in America by Outside Magazine.
Cost
Average Net Price
$14,602 / year
This is the average annual amount that first-time, full-time undergraduate students pay at this institution after subtracting all grants and scholarships from the cost of attendance.
Show Net Price details
Net cost after grants and scholarships by income
$0-$30,000:
$11,861
$30,001-$48,000:
$14,030
$48,001-$75,000:
$15,523
$75,001-$110,000:
$19,162
Over $110,000:
$19,850
This net price data shows the average amount students have paid, according to their family income, after subtracting all grants and scholarships.
College Profile
Student/Faculty Ratio
16:1
Size of Student Body
4,372
Average Class Size
17
Show Undergraduate Student Body details
Breakdown by Race
American Indian or Alaska Native:
1%
Black or African American:
3%
Hispanic:
4%
Asian:
2%
White:
81%
Two or more races:
5%
International Students:
1%
Unknown:
2%
Breakdown by Age
19 and Younger:
29%
20 to 24:
39%
25 to 34:
20%
35 to 44:
8%
45 and Older:
4%
Breakdown by Gender
Men:
42%
Women:
56%
New entering students who are transfers
36%
Student Success
Graduation Rate for Two-Year Programs
38%
Show Graduation Rate 2-yr Institution details
Completers within 3 years by race
American Indian or Alaska Native:
25%
Black or African American:
14%
Hispanic:
42%
Asian:
25%
White:
40%
Two or more races:
24%
Completers within 3 years by Gender
Men:
34%
Women:
43%
Retention Rate
59%
Show Retention Rate details
Retention Rate By Type
Full-time:
65%
Part-time:
56%
Campus Settings
Financial Aid
Average amount of federal, state, local, institutional or other sources of grant aid awarded to undergraduate students
$3,672
The following information pertains to first-time full-time undergraduate students.
Show Financial Aid details
Average amount of aid awarded to full-time first-time undergraduates
State/Local grant aid:
$1,517
Institutional grant aid:
$1,498
Federal grant aid:
$2,196
Average amount of grant aid awarded by income (all sources)
$0-$30,000:
$5,326
$30,001-$48,000:
$5,061
$48,001-$75,000:
$3,937
$75,001-$110,000:
$981
Over $110,000:
$83
School Scholarships
Yes
Required Financial Aid Application(s):
Financial Aid Application Deadline(s):
n/a
Title IV (FAFSA) School Code:
005757
Financial Aid Contact
Cumulative Debt
This section shows the median debt graduates incurred to complete their degree at this institution.
Median Cumulative Debt by Degree Type
- Associate's Degree: $12,750
- Undergraduate Certificate: $10,750
Percent of Graduates With Loans
- Associate's Degree: 13%
- Undergraduate Certificate: 26%
Admission Information
Application Fee
$0
- System applications (online)
- System applications (paper)
- School applications (online)
- School applications (paper)
- High School Diploma or GED
- Transcripts
- Accepts dual credits
- Accepts exam-based credits
- Institution awards credits for military training
Application Timelines
Financial Aid Application Deadline
n/a
Open Admissions Deadline
Friday before the start of the term
Admissions Contact
Graduate Employment Outcomes
The data displayed below comes from the Graduate Employment Outcomes tool and only reports on graduates employed in Minnesota. This section shows employment data for graduate class of 2020, including percent of graduates with full-time employment in the 3rd year after college graduation and the median annual wages by award level, according to the Minnesota unemployment insurance records. Data does not include federal employees, self-employed (e.g. professional freelancers, artists, developers, designers, business owners), military, or individuals who moved out of state for a job. The list below may be incomplete and limited to some majors. Additionally, data has been suppressed when it refers to 10 or less students.Jump to:
This profile features institution-wide data. Be aware that some categories may not be showing and that data is suppressed when reporting is for 10 or less students. Most data and terminology is sourced from IPEDS. To learn more about each section, please refer to Data Sources.
The College Search Tool provides information and reported data for postsecondary institutions in Minnesota that receive federal and state financial aid. For licensed occupational training providers in Minnesota, please visit OHE's Licensed Career Schools.