1520 St. Olaf Avenue
Northfield, MN 55057-1098
United States
About
St. Olaf’s 3,000 students come from 90 countries, every state, and a variety of religious and non-religious backgrounds. Oles choose from more than 85 majors, concentrations, and pre-professional tracks, and 97% live on campus. Two-thirds of St. Olaf students study abroad. Oles participate in 26 varsity teams, play and sing with multiple world-renowned music ensembles, and belong to 200 student organizations.
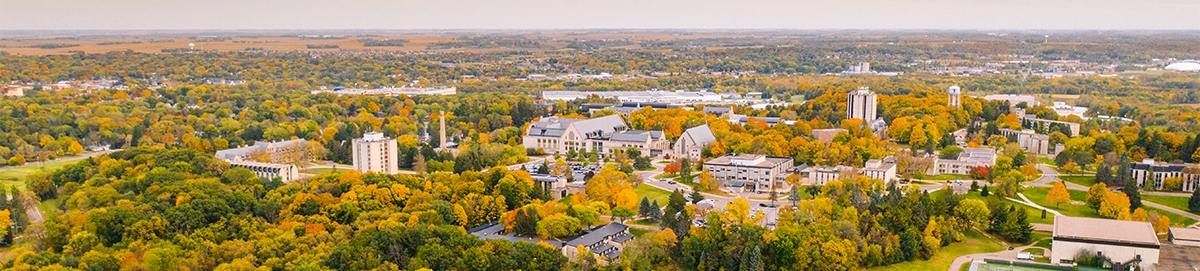
Our beautiful 300-acre campus is located in Northfield, approximately 40 miles south of the Twin Cities.
Cost
This is the average annual amount that first-time, full-time undergraduate students pay at this institution after subtracting all grants and scholarships from the cost of attendance.
Show Net Price details
This net price data shows the average amount students have paid, according to their family income, after subtracting all grants and scholarships.
College Profile
Show Undergraduate Student Body details
Student Success
Show Graduation Rate 4-yr Institution details
Campus Settings
Financial Aid
The following information pertains to first-time full-time undergraduate students.
Show Financial Aid details
Cumulative Debt
This section shows the median debt graduates incurred to complete their degree at this institution.
- Bachelor's Degree: $26,000
- Bachelor's Degree: 59%
Admission Information
- Common applications (online)
- Common applications (paper)
- High School Diploma or GED
- Transcripts
- Letters of Recommendation
- Application Essay
- Accepts dual credits
- Accepts exam-based credits
Financial Aid Application Deadline
No additional scholarship application needed; scholarships are awarded based on application for admission. Early Decision I and Early Action candidates: November 1 * Early Decision II and Regular Decision candidates: January 15 *
Regular Decision Deadline
January 15
Early Action Deadline
November 1
Early Decision Deadline
2 rounds: Round 1 November 1, Round 2 January 15