1049 University Drive
Duluth, MN 55812
United States
Bachelor's Degree
Graduate (Certificates and Degrees)
About
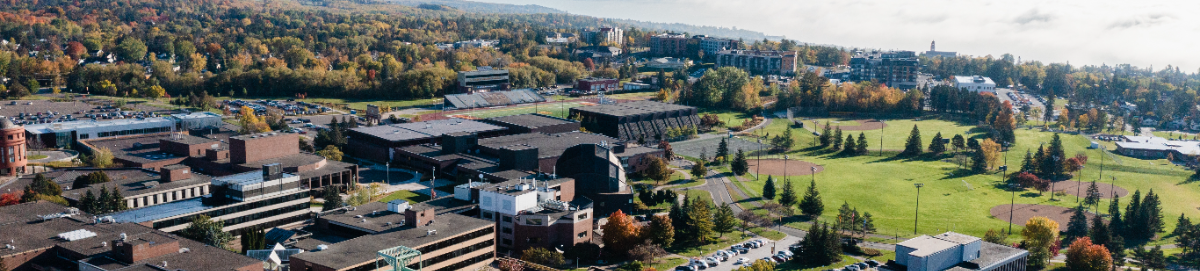
The University of Minnesota Duluth (UMD) is Minnesota's highest-ranked public regional university and #4 in the Midwest according to U.S. News & World Report. Nestled on the shores of Lake Superior, UMD seamlessly integrates academic excellence with hands-on discovery in a breathtaking natural setting.
Our medium-sized campus features a 16:1 student-faculty ratio and an enrollment of just under 9,500 students. UMD offers more than 150 majors and minors and 24 graduate fields of study. Learning extends beyond traditional classrooms as students and faculty collaborate on meaningful research like clean water initiatives while leveraging unparalleled recreational opportunities that make this location unique.
As one of five campuses that comprise the University of Minnesota System, UMD prepares globally engaged citizens through dynamic interdisciplinary education, research, and community engagement—creating a truly balanced and immersive university experience where education meets adventure.
Cost
Living On-Campus
28,920
Living Off-Campus
28,270
Living with Family
21,700
Average Net Price
$19,542 / year
This is the average annual amount that first-time, full-time undergraduate students pay at this institution after subtracting all grants and scholarships from the cost of attendance.
Show Net Price details
Net cost after grants and scholarships by income
$0-$30,000:
$6,393
$30,001-$48,000:
$7,919
$48,001-$75,000:
$11,619
$75,001-$110,000:
$18,262
Over $110,000:
$24,658
This net price data shows the average amount students have paid, according to their family income, after subtracting all grants and scholarships.
College Profile
Student/Faculty Ratio
16:1
Size of Student Body
9,861
Average Class Size
27
Graduate Students Enrolled
864
Show Undergraduate Student Body details
Breakdown by Race
American Indian or Alaska Native:
1%
Black or African American:
2%
Hispanic:
4%
Asian:
3%
White:
84%
Two or more races:
4%
International Students:
1%
Unknown:
1%
Breakdown by Age
19 and Younger:
45%
20 to 24:
52%
25 to 34:
2%
35 to 44:
1%
45 and Older:
0%
Breakdown by Gender
Men:
51%
Women:
49%
New entering students who are transfers
14%
Student Success
Graduation Rate for Four-Year Programs
64%
Show Graduation Rate 4-yr Institution details
Completers within 6 years by race
American Indian or Alaska Native:
44%
Black or African American:
47%
Hispanic:
63%
Asian:
47%
Native Hawaiian or Other Pacific Islander:
100%
White:
66%
Two or more races:
61%
Unknown:
50%
Completers within 6 years by gender
Men:
65%
Women:
64%
Retention Rate
80%
Show Retention Rate details
Retention Rate By Type
Full-time:
81%
Part-time:
43%
Campus Settings
Financial Aid
Average amount of federal, state, local, institutional or other sources of grant aid awarded to undergraduate students
$7,612
The following information pertains to first-time full-time undergraduate students.
Show Financial Aid details
Average amount of aid awarded to full-time first-time undergraduates
State/Local grant aid:
$5,689
Institutional grant aid:
$3,180
Federal grant aid:
$5,037
Average amount of grant aid awarded by income (all sources)
$0-$30,000:
$22,764
$30,001-$48,000:
$21,608
$48,001-$75,000:
$14,436
$75,001-$110,000:
$8,207
Over $110,000:
$1,804
School Scholarships
Yes
Financial Aid Contact
Cumulative Debt
This section shows the median debt graduates incurred to complete their degree at this institution.
Median Cumulative Debt by Degree Type
- Bachelor's Degree: $25,375
- Master's Degree: $36,616
Percent of Graduates With Loans
- Bachelor's Degree: 68%
- Master's Degree: 59%
Admission Information
Application Fee
$40
- Common applications (online)
- System applications (online)
- School applications (online)
- High School Diploma or GED
- Transcripts
- Accepts dual credits
- Accepts exam-based credits
- Institution awards credits for military training
Application Timelines
Rolling Admissions Deadline
Dec 1 (priority) & Aug 1 (final)
Admissions Contact
Graduate Employment Outcomes
The data displayed below comes from the Graduate Employment Outcomes tool and only reports on graduates employed in Minnesota. This section shows employment data for graduate class of 2020, including percent of graduates with full-time employment in the 3rd year after college graduation and the median annual wages by award level, according to the Minnesota unemployment insurance records. Data does not include federal employees, self-employed (e.g. professional freelancers, artists, developers, designers, business owners), military, or individuals who moved out of state for a job. The list below may be incomplete and limited to some majors. Additionally, data has been suppressed when it refers to 10 or less students.Jump to:
This profile features institution-wide data. Be aware that some categories may not be showing and that data is suppressed when reporting is for 10 or less students. Most data and terminology is sourced from IPEDS. To learn more about each section, please refer to Data Sources.
The College Search Tool provides information and reported data for postsecondary institutions in Minnesota that receive federal and state financial aid. For licensed occupational training providers in Minnesota, please visit OHE's Licensed Career Schools.